Orogenic Exploration Pty Ltd
Welcome
Consulting
• Australian Potash Brine
• Capturing Data
• Ellendale Lamproite
• Parnaroo Loam Grid
• World Map Index
Projects ↴
• Flinders Island
Previous Projects ↴
• Eyre Peninsula
• Shell Lagoon
• Terowie South
Project Generation
Image Galleries ↴
• Diamond Exploration
• Metal Exploration
Contact
Australian Potash Brine
AUSTRALIAN SALINE POTASH
As part of the exploration consulting practice by Orogenic Exploration, an extensive database has been compiled on Australian potash brine deposits.
POTASH BRINES
Over the last 15 years, exploration for brines containing potash has escalated in Australia. Nitrogens (N), phosphates (P) and potash (K) are the three major fertiliser types widely used. Potash is water-soluble, and certain natural brines depending on their chemistry can be used to create Sulphate of Potash (SOP), also called Potassium Sulphate (K2SO4). SOP is a low chloride, premium fertiliser applied primarily on high value crops and is the second most common potash type (after the chloride containing MOP).
Orogenic Exploration has captured and collated available brine water analyses across Australia. This is not just published reserves but all available individual water samples defining a deposit have been captured in detail. This has incorporated the standardisation of the samples geographical and analytical units. While the brine analyses have been completed by different laboratories (e.g. Bureau Veritas, ALS, NTEL, Genalysis) and differing methods (but mainly ICP based) it is apparent that natural fluctuations in saline chemistry due to rainfall and other weather variations are often more significant than variations in analytical procedures.
The data has been captured from ASX company public releases and from open-file company reports from the various Mines Departments. All individual samples have full geographical, sampling and analytical details together with company, exploration licence and reference information. Western Australia has the most prospective known brine lake systems therefore the majority of data is from that state.

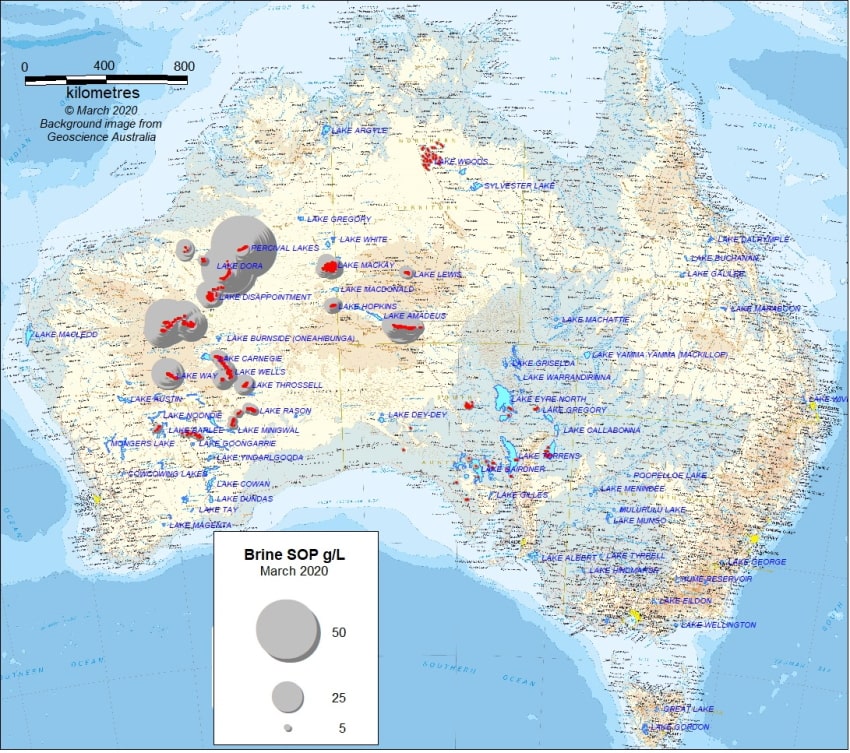
As Sulphate of Potash (SOP) is the primary objective this has been calculated for each brine analysis as a method of ranking individual local surface waters and aquifers. Percival Lakes in northern Western Australia has the highest calculated near surface SOP concentration in Australia. These samples were collected at depths less than a metre below the dry lake surface (Johnston, 2015). The table below lists selected lake systems sorted by decreasing averaged SOP concentrations (in g/L which is the same as kg/m3).
| Lake Area | State | Sample Count |
SOP Average |
SOP Maximum |
Ca Average |
K Average |
Mg Average |
Na Avgerage |
Cl Average |
S Average |
| Percival Lakes | W.A. | 53 | 31.5 | 50.4 | 346 | 14108 | 7037 | 91645 | 158625 | 10570 |
| Williamson Pit, Wiluna | W.A. | 9 | 25.3 | 25.6 | 176 | 11356 | 14489 | 107000 | 179583 | 15993 |
| Lake Auld | W.A. | 49 | 22.4 | 43.5 | 399 | 10041 | 8566 | 74905 | 126544 | 13194 |
| Lake Aerodrome | W.A. | 40 | 17.2 | 23.0 | 575 | 7693 | 7234 | 74644 | 130413 | 7043 |
| Beyondie Lakes | W.A. | 46 | 17.0 | 25.4 | 715 | 7617 | 5324 | 50365 | 89589 | 6996 |
| White Lake | W.A. | 58 | 16.8 | 25.2 | 563 | 7513 | 7004 | 64335 | 109476 | 8605 |
| Central East Lake | W.A. | 10 | 16.7 | 25.2 | 567 | 7506 | 8201 | 57230 | 103045 | 8994 |
| Yanneri Lake | W.A. | 30 | 15.0 | 24.1 | 717 | 6725 | 6846 | 42128 | 75377 | 8018 |
| Lake Sunshine | W.A. | 42 | 14.9 | 29.0 | 715 | 6703 | 6110 | 63712 | 111270 | 6086 |
| Terminal Lake | W.A. | 21 | 13.3 | 36.6 | 857 | 5954 | 5721 | 43886 | 79388 | 6266 |
| Ten Mile Lake | W.A. | 42 | 12.4 | 28.5 | 576 | 5570 | 5113 | 39545 | 66836 | 5355 |
| Central West Lake | W.A. | 110 | 12.3 | 28.1 | 803 | 5507 | 8516 | 57201 | 109621 | 5226 |
| Lake Wilderness | W.A. | 21 | 12.2 | 17.3 | 962 | 5468 | 6207 | 42126 | 81774 | 4445 |
| Lake Disappointment | W.A. | 89 | 12.0 | 20.0 | 458 | 5399 | 6109 | 96127 | 152506 | 8522 |
| T-Junction North | W.A. | 20 | 12.0 | 15.9 | 1048 | 5367 | 6144 | 43303 | 82688 | 4405 |
| Lake Way, Wiluna | W.A. | 135 | 11.2 | 19.5 | 566 | 5008 | 6013 | 59293 | 98815 | 7084 |
| Northern | W.A. | 12 | 10.5 | 25.9 | 1165 | 4724 | 5649 | 34656 | 68400 | 3569 |
| Lake Aerodrome NE | W.A. | 15 | 10.5 | 13.4 | 1209 | 4689 | 6090 | 39213 | 77660 | 3718 |
| Uncertain | W.A. | 22 | 10.4 | 31.7 | 801 | 4663 | 3070 | 50130 | 83011 | 5147 |
| Lake Throssell | W.A. | 90 | 10.1 | 14.9 | 598 | 4548 | 8195 | 77738 | 136400 | 7185 |
| Lake Waukarlycarly | W.A. | 5 | 10.0 | 13.2 | 480 | 4492 | 6168 | 74210 | 119394 | 12514 |
| Lake George | W.A. | 13 | 9.8 | 13.4 | 532 | 4375 | 2588 | 81054 | 126932 | 7164 |
| Lake Wells, WA | W.A. | 725 | 9.0 | 16.0 | 628 | 4038 | 7519 | 72118 | 122913 | 6331 |
| Karinga Creek | N.T. | 166 | 8.8 | 27.0 | 521 | 3965 | 6373 | 72476 | 112290 | 9245 |
| Lake Hopkins | N.T. | 67 | 8.5 | 10.9 | 497 | 3825 | 4032 | 89180 | 125004 | 10037 |
| Karinga Creek central | N.T. | 36 | 8.4 | 14.3 | 627 | 3770 | 5092 | 100050 | 150711 | 8215 |
| Lake Wilderness South | W.A. | 1 | 8.3 | 8.3 | 1170 | 3740 | 3660 | 28700 | 53600 | 3400 |
| Lake Winifred | W.A. | 24 | 8.1 | 12.2 | 726 | 3641 | 1640 | 73985 | 117923 | 4945 |
| Lake Sunshine NE | W.A. | 19 | 7.9 | 9.7 | 1160 | 3536 | 4849 | 37132 | 67721 | 4004 |
| Lake MacKay | N.T. | 275 | 7.6 | 14.5 | 428 | 3430 | 2945 | 101174 | 155260 | 7296 |
| Lake Lewis, NT | N.T. | 9 | 7.5 | 8.7 | 562 | 3386 | 1726 | 80911 | 122122 | 7352 |
| Carnegie Lakes | W.A. | 78 | 7.4 | 10.7 | 942 | 3314 | 3427 | 77824 | 123654 | 4023 |
| T-Junction South | W.A. | 7 | 7.1 | 7.7 | 1499 | 3200 | 4091 | 30171 | 64371 | 2822 |
| Lake Winifred West | W.A. | 8 | 7.1 | 13.5 | 826 | 3166 | 1552 | 79481 | 126568 | 4795 |
| Lake Disappointment East | W.A. | 5 | 5.8 | 8.4 | 748 | 2580 | 2600 | 80676 | 172525 | 4442 |
| Lake Rason | W.A. | 178 | 4.8 | 8.0 | 494 | 2167 | 9034 | 76185 | 134246 | 6738 |
| Lake Hope Campbell | W.A. | 54 | 4.8 | 6.7 | 2142 | 8711 | 83881 | 137883 | 7516 | |
| Lake Dora | W.A. | 95 | 4.3 | 7.7 | 684 | 1917 | 2627 | 25260 | 6382 | |
| Lake Seabrook | W.A. | 11 | 4.2 | 9.4 | 516 | 1905 | 12436 | 96213 | 5458 | |
| Lake Marmion | W.A. | 15 | 4.2 | 6.4 | 777 | 1873 | 8346 | 85113 | 147597 | 3592 |
| Lake Barlee, WA | W.A. | 38 | 3.9 | 5.4 | 771 | 1740 | 4904 | 88740 | 149870 | 3679 |
| Lake Ballard | W.A. | 17 | 3.8 | 4.7 | 1057 | 1701 | 6544 | 77082 | 139232 | 2534 |
| Lake Gairdner | S.A. | 3 | 3.7 | 5.1 | 2019 | 1652 | 11801 | 100733 | 192550 | 1013 |
| Lake MacDonnell, SA | S.A. | 29 | 2.8 | 5.6 | 1153 | 1254 | 5190 | 36018 | 64437 | 2882 |
| Curara Soaks | W.A. | 12 | 2.2 | 4.7 | 617 | 989 | 335 | 30801 | 475 | 1750 |
| Lake Disappointment north | W.A. | 38 | 2.0 | 5.5 | 684 | 914 | 223 | 30130 | 64818 | 1664 |
| Yorke Peninsula, SA | S.A. | 1 | 1.8 | 1.8 | 1178 | 828 | 190 | 62100 | 98300 | 396 |
| Wudinna | S.A. | 6 | 1.4 | 2.5 | 559 | 648 | 2976 | 33552 | 56975 | 2230 |
| Lake Cadibarrawirracanna | S.A. | 36 | 1.2 | 2.9 | 573 | 528 | 15345 | 49338 | 97632 | 6245 |
| Pidinga Lakes, SA | S.A. | 1 | 1.1 | 1.1 | 505 | 485 | 2240 | 20800 | 35200 | 2080 |
| Lake Eyre, SA | S.A. | 9 | 0.9 | 2.4 | 838 | 417 | 3402 | 93923 | 146991 | 4169 |
| Island Lagoon, SA | S.A. | 8 | 0.5 | 1.1 | 1006 | 233 | 2633 | 62488 | 104419 | 1476 |
| Wilkinson Lakes | S.A. | 1 | 0.4 | 0.4 | 310 | 200 | 710 | 7700 | 5400 | |
| Lake Gregory, SA | S.A. | 6 | 0.3 | 0.5 | 2180 | 129 | 2900 | 69800 | 108800 | 2187 |
| Lake Frome | S.A. | 38 | 0.2 | 0.7 | 664 | 93 | 881 | 43568 | 74406 | 1929 |
| Lake Torrens | S.A. | 34 | 0.2 | 0.4 | 708 | 69 | 1121 | 34818 | 55896 | 1087 |
| Lake Woods, NT | N.T. | 40 | 0.1 | 0.1 | 68 | 26 | 39 | 88 | 112 | 33 |
| © 2021 Orogenic Exploration Pty Ltd SOP (Sulphate of Potash) grade calculated from potassium (K) by conversion factor. All values are mg/L except SOP which is g/L. Data from ASX releases and Mines Department open-file company reports. Average values are the rounded arithmetic mean of individual sample assays. Sample count is the number of samples used to calculate the average. |
||||||||||
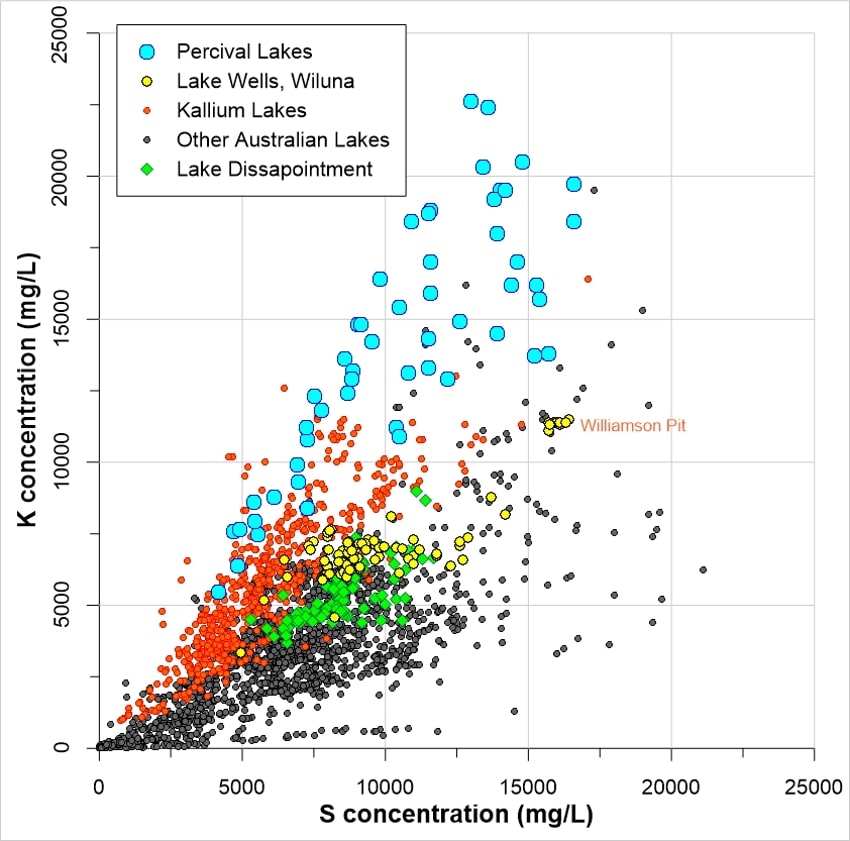
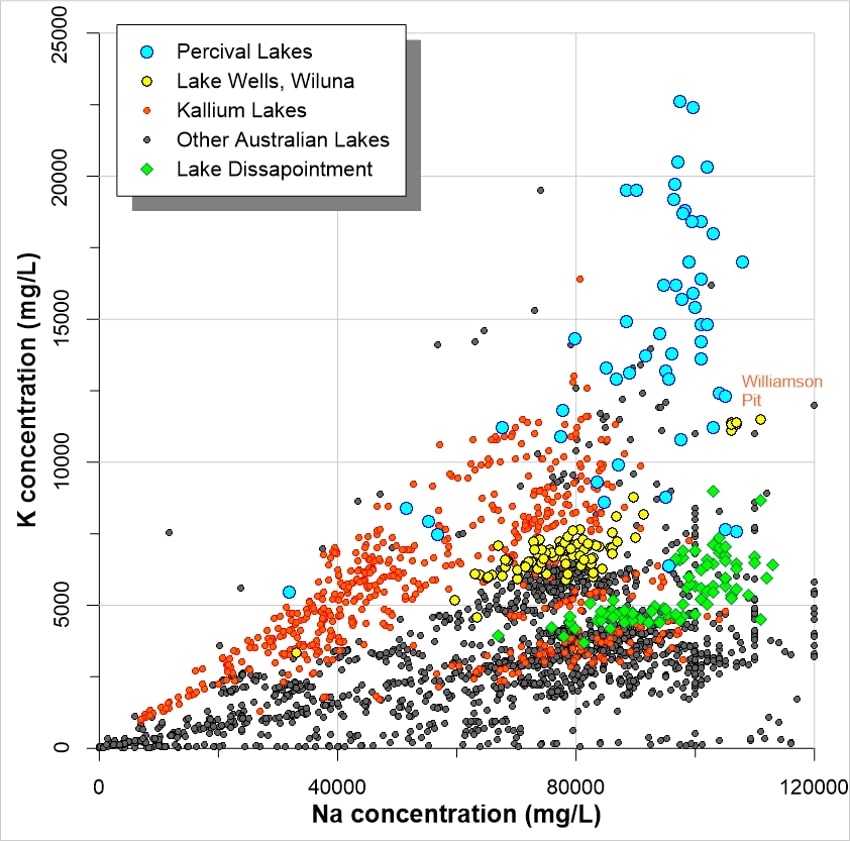
Having this detailed data allows for plotting and examination of relationships and trends. The two graphs below show brine potassium (K) concentration verses Sulphur (S) and Sodium (Na) concentrations. Samples from selected lake systems are highlighted and clear trends are evident. Separate grouping of samples from one geographical lake system would indicate separated water bodies, probably related to depth of sample (captured if provided). Often water samples at or very near surface are disconnected from deeper palaeochannel water samples by impervious clay layers associated with the lake sediments.
The data can provide information on the ratios of the different salts. To create SOP from brines you require potassium but sufficient sulphide is also required. Brines having a higher excess of common salt (NaCl) will require extra processing.


Brine water has filled the abandoned Williamson Gold Mine large opencut pit located within (normally dry) Lake Wells near Wiluna in central Western Australia. This single body of water has an average of 25.3 g/L SOP from a number of water samples from different depths and locations across the pit (Salt Lake Potash, ASX release 12/3/2018). The Lake Way pit samples plot close together in the plots above as expected given the very similar salt concentrations from the single body of water.
LITHIUM BRINE
There appears to be little potential for lithium brines in Australia based on available data. While individual brine analyses are not often released, brines in Argentina can reach at least 1000mg/L in Li concentration (Galan Lithium ASX Release 6/10/19). This compares with the best known lake brine in Australian containing only 3mg/L Li from a lake near Wudinna on the Eyre Peninsula (Belperio & Godsmark, 2017). Unfortunately Lithium is not listed as an analysed element in many brine water samples so there may be better values not reported from Australia. Other than near Wudinna, all available Australian brine analyses are below 1mg/L Li.
While the Geoscience Australia Record 2013/39 (Mernagh (ed), 2013) mentions lithium brine exploration around Lake Dumbleyung in Western Australia and Lakes Torrens and Frome in South Australia both these exploration programs was not successful and quickly abandoned.
BORON BRINE
Some of the Argentina brines contain up to approximately 600mg/L boron (Candelas area, Galan Lithium Ltd). In Australia the near surface brine with the highest known boron concentration is Lake Auld in Western Australia. River Rock Energy Ltd sample 15WS077 contained 46mg/L and sample 15WS073 contained 42mg/L boron (Johnston, 2015) from this lake. The data on boron is limited, like lithium, with only 15% of available Australian brine available analyses including this element.
CONCLUDING REMARKS
While potash brine concentration is a very important parameter in economic assessment, there are many other issues that need to be considered. Thus the data presented here should not and cannot be used in making investing decisions without further external advice. All data is sourced from open-file Mines Department reports or ASX public releases. Orogenic Exploration has taken all due care in the data compilation but takes no responsibility for any errors including errors in the source documentation.
If you are interested in further details on brine in Australia please contact us. If you are aware of any public data omissions, misrepresentation or factual errors please also contact Orogenic Exploration.
Authorised by Steven Cooper
Maintained by Ian Savicky
Copyright Notice and Disclaimer